In these articles, I normally tell you about the species data TVERC receives, especially about interesting, large or particularly challenging data sets. This time I’m going to do something different. I’m going to feature our species database and some of the work we’ve been doing to understand it better, and how we are starting to use it to inform and cross-reference to our habitat data. I know that even the word “database” is a bit of a turn-off. However, don’t stop reading because I’m not going to turn “super techy”!
To begin, I’ll explain some ancient history. our species records—totalling 4.8 million—reside in a relational database managed by the Recorder 6 software. This database originated in 2010 through the consolidation of several earlier databases curated by different individuals and organizations. Since then, TVERC has continued to add records and import data from the BBOWT reserves database. As a result, our species database is extensive and comprehensive, but admittedly a bit chaotic due to varying curation approaches over the years.
To give you an analogy (a cycling one!), it’s a bit like inheriting a cycle mending workshop that has been run by generations of different cycle mechanics. Luckily, they all agree about where the obvious, important and everyday things (spanners, spare inner tubes, bike pumps etc.) should be stored. However, what if I need a 10mm Allen key? There’s a pile of them in a drawer marked “cone spanners”, some on a work bench and even more on the floor next to some old rags, but is there a 10mm one among them? Like that, some of our database curators have decided that, say abundance information, should be stored in one place, some in another, and some have hedged their bets and put the information in both places, just in case!
Approximately a decade ago, I collaborated with a computer consultant—one of the few individuals who truly grasped the intricacies of the Recorder 6 database. Together, we designed custom code to transform our database into a clean, streamlined flat database that includes only the essential information we regularly use. I execute this code weekly to generate a fresh flat database, while leaving the original Recorder 6 database untouched as our ‘top copy.’ Imagine it as assembling a team to sift through a cluttered bicycle workshop, identifying the necessary tools for repairs, and then creating a separate, well-organized workshop elsewhere in the building with brand-new, properly labelled equipment. Our bespoke and complex program has served us exceptionally well, simplifying our interaction with species records.
Earlier this year, the consultant who’d written the code and was maintaining it retired. Daniela and I spent a lot of time picking his brains. Now, we have a solid understanding of both the code, and the Recorder 6 database tables it cleans. This knowledge enables us to maintain, document, and further develop the software going forward. While it was quite challenging, having this expertise ‘in-house’ has already led to more effective utilization of our species data.
With help from our survey team, we’ve compiled tables of indicator and typical species associated with priority habitats. Indicator species are often scarce species whose presence strongly indicates a particular habitat. Typical species are usually common species found in that habitat, but also more generally. For instance, spiny restharrow serves as an indicator of lowland calcareous grassland, while wild carrot (more widespread) is considered typical. Using these lists and our newfound understanding of the database structure, we’ve tagged all our typical and indicator species records. Now, when there’s uncertainty about whether a particular parcel of land qualifies as a priority habitat, we can cross-reference the observed typical/indicator species. This valuable information enhances the quality of our habitat data, which increasingly informs conservation decisions in our two counties.
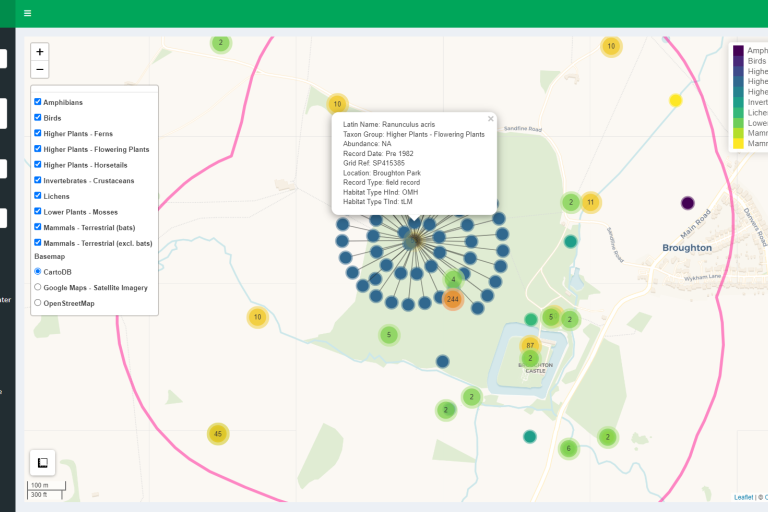
Another spin-off from this work is that Daniela has written an App to help the survey team visualise the indicator/typical species within Local Wildlife sites, aiding in assessing site conditions and tracking changes over time. In the example of Broughton Castle (an Oxfordshire LWS), each dot on the image represents typical/indicator species records from different taxon groups. Clicking on a dot reveals a “wheel” of records, providing detailed information about each species. In the example below we’ve clicked on a record of meadow buttercup which is a typical species of lowland meadow and an indicator of open mosaic habitats. The app also enables the extraction of species tables for Local Wildlife Survey Reports, streamlining the process for the survey team.

This has been a steep learning curve for both of us I, but it’s great that out of some esoteric “techy” work, we’ve realised that we can do things of real practical use with the data in our database.